First quarter earnings season was solid by just about any measure, but based on recent market behavior it’s obvious that in general market participants paid little attention. This is a macro-driven market, so it will likely take positive macro developments, i.e., better news on the inflation front, to turn stocks around. However, these results are impressive on their own and shouldn’t hurt the case for the bulls. The question is when will the micro stop getting drowned out by the macro.
By the Numbers
In our earnings season preview, we expected a high single-digit increase in S&P 500 Index earnings for the quarter, and that is what we got. The consensus estimate coming into reporting season was calling for a 4.7% earnings gain, and now it looks like 10% is possible with more than 40 index constituents still left to report results [Figure 1].
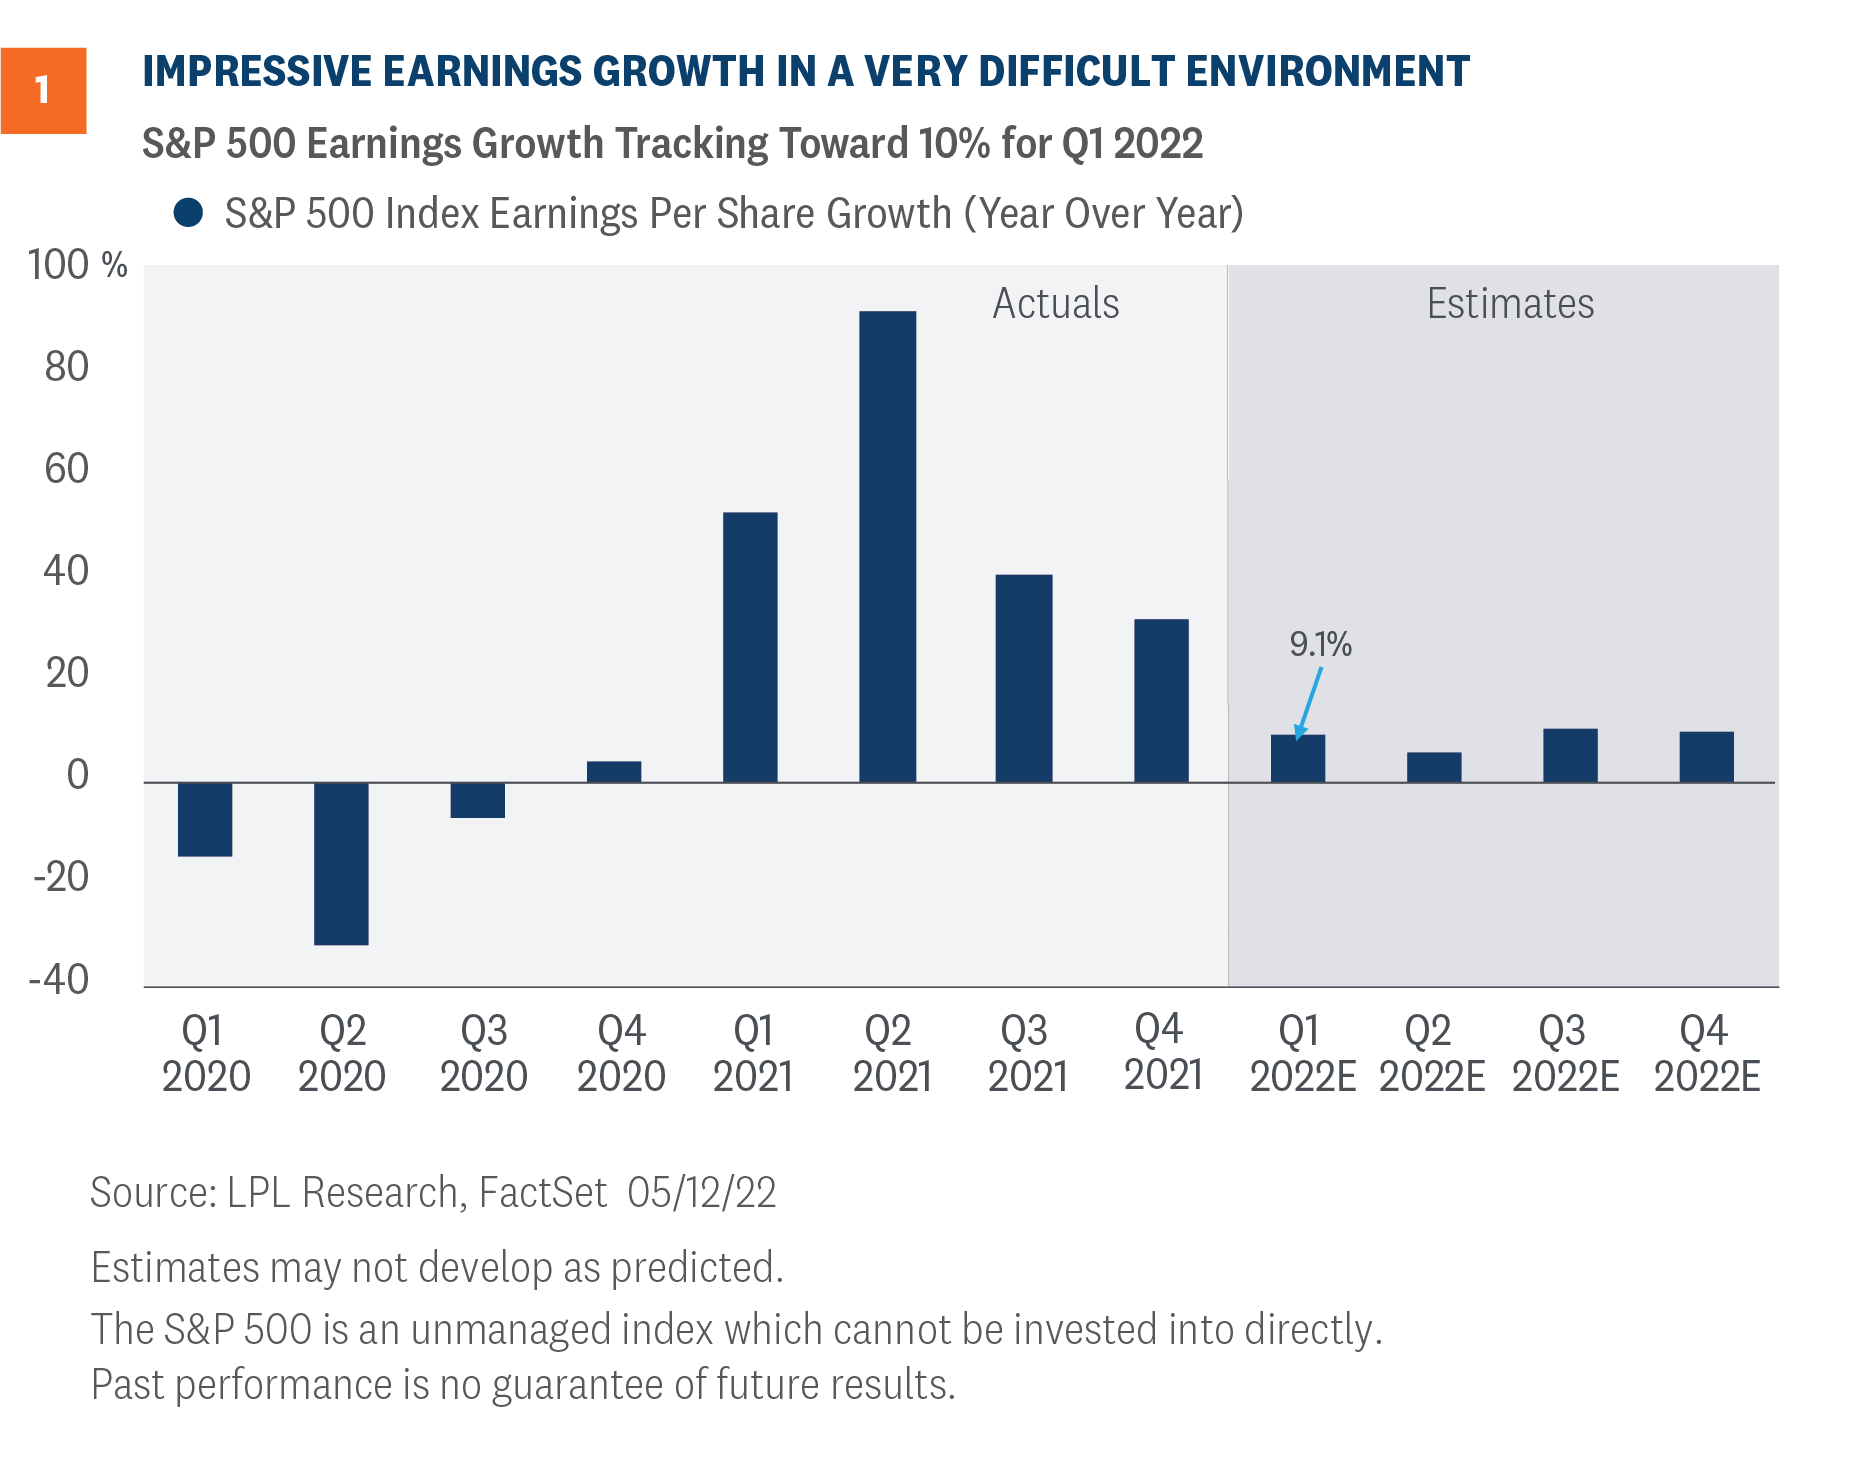
This is an impressive result given the challenges currently facing companies—intense cost pressures, COVID-19, and Russia’s Ukraine invasion with resulting sanctions.
The revenue growth corporate America was able to generate—over 13% year over year—was perhaps even more impressive. An upside surprise of about 2.7 percentage points doesn’t sound like a lot, but for revenue it is. Revenue is easier to predict, and companies can’t cost cut their way to more sales. The five-year average is 1.7 points of revenue upside, and the pre-pandemic average was 0.8.
Here are some more numbers to put these impressive results in perspective:
- A very strong 78% of S&P 500 companies beat earnings estimates for the quarter, slightly above the long-term average of 77%.
- Excluding financials, S&P 500 earnings per share are on track to grow about 14%.
- Excluding energy, S&P 500 earnings per share are on track to grow only about 4%.
- The biggest upside earnings surprises came from utilities, while consumer staples, financials, healthcare, and materials also generated strong upside surprises.
- Consumer discretionary was the only sector to miss analysts’ earnings target, falling a massive 35% short due to Amazon. The LPL Research Strategic and Tactical Asset Allocation Committee (STAAC) remains underweight to the consumer discretionary sector.
- A solid 74% of S&P 500 companies have beaten revenue forecasts, above the five-year average of 69%.
- About half of the revenue growth for the quarter came from the energy and healthcare sectors.
- The biggest upside revenue surprises came from energy and utilities, while only communication services missed analysts’ revenue target.
Biggest Challenge: Profit Margins
In our earnings season preview on April 18, we highlighted three things to watch: margin pressures, pricing power, and supply chain status. Clearly two of those three things relate to profit margins, though we would argue all three do.
In this inflationary environment, the revenue is coming through. But it is profit margins that were the biggest test for corporate America this quarter, and companies passed that test with flying colors. Not only did margins hold up well quarter over quarter—falling less than anticipated—but analysts’ estimates for margins going forward still show margin expansion from current levels [Figure 2]. We know analysts’ estimates tend to be overly optimistic, but we still view the trajectory of these forecasts as a positive sign for future profitability.
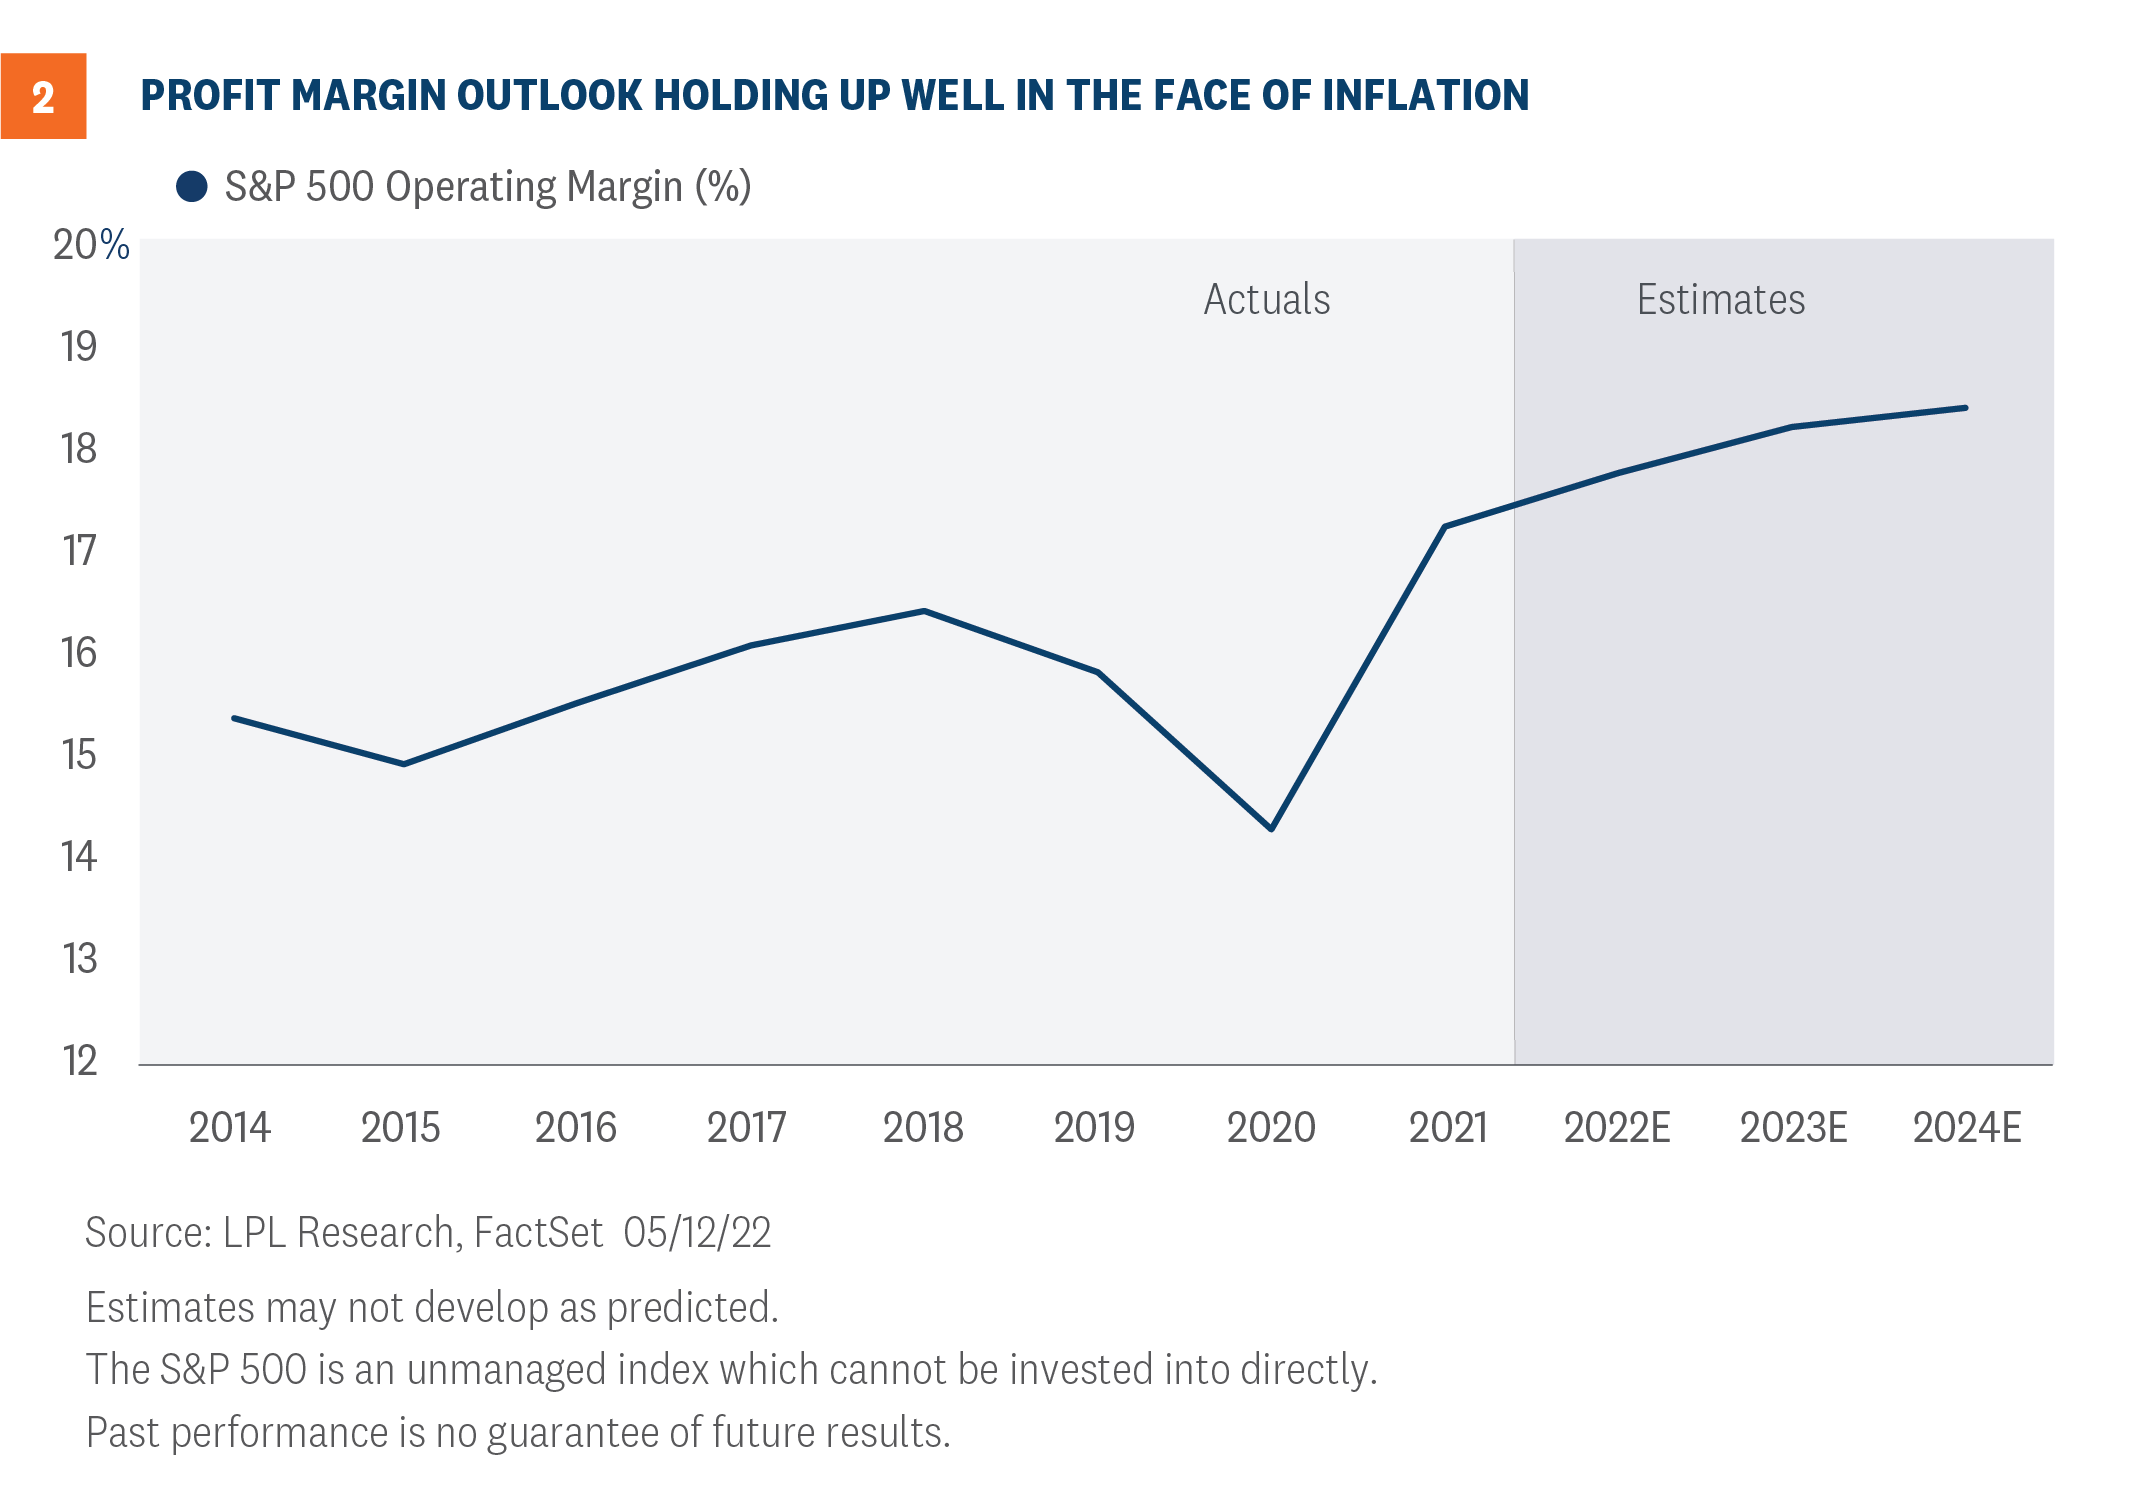
However, these margin forecasts will be tough to reach in the coming year if high inflation lingers. Although signs of a peak in inflation have emerged, the pace of improvement may be stubbornly slow. It’s difficult to envision the labor market getting significantly better in a short period of time, but labor market participation is key to alleviating wage pressures and wages are the biggest component of companies’ cost structures. And company guidance suggests supply chain disruptions may linger well into the fall, longer than we previously anticipated.
Estimates Keep Going Higher
Inflation is not a new challenge for companies. The Consumer Price Index has increased more than 6% year over year for seven months now. Last fall, before Russia’s Ukraine invasion, in Outlook 2022: Passing the Baton, we wrote the following:
With stable profit margins and increasing share buybacks likely next year, a double-digit percentage increase in S&P 500 earnings per share (EPS) is a possibility. But COVID-19-related supply chain issues and materials and labor shortages are risks that could lead to higher costs in 2022, weighing on profit margins.
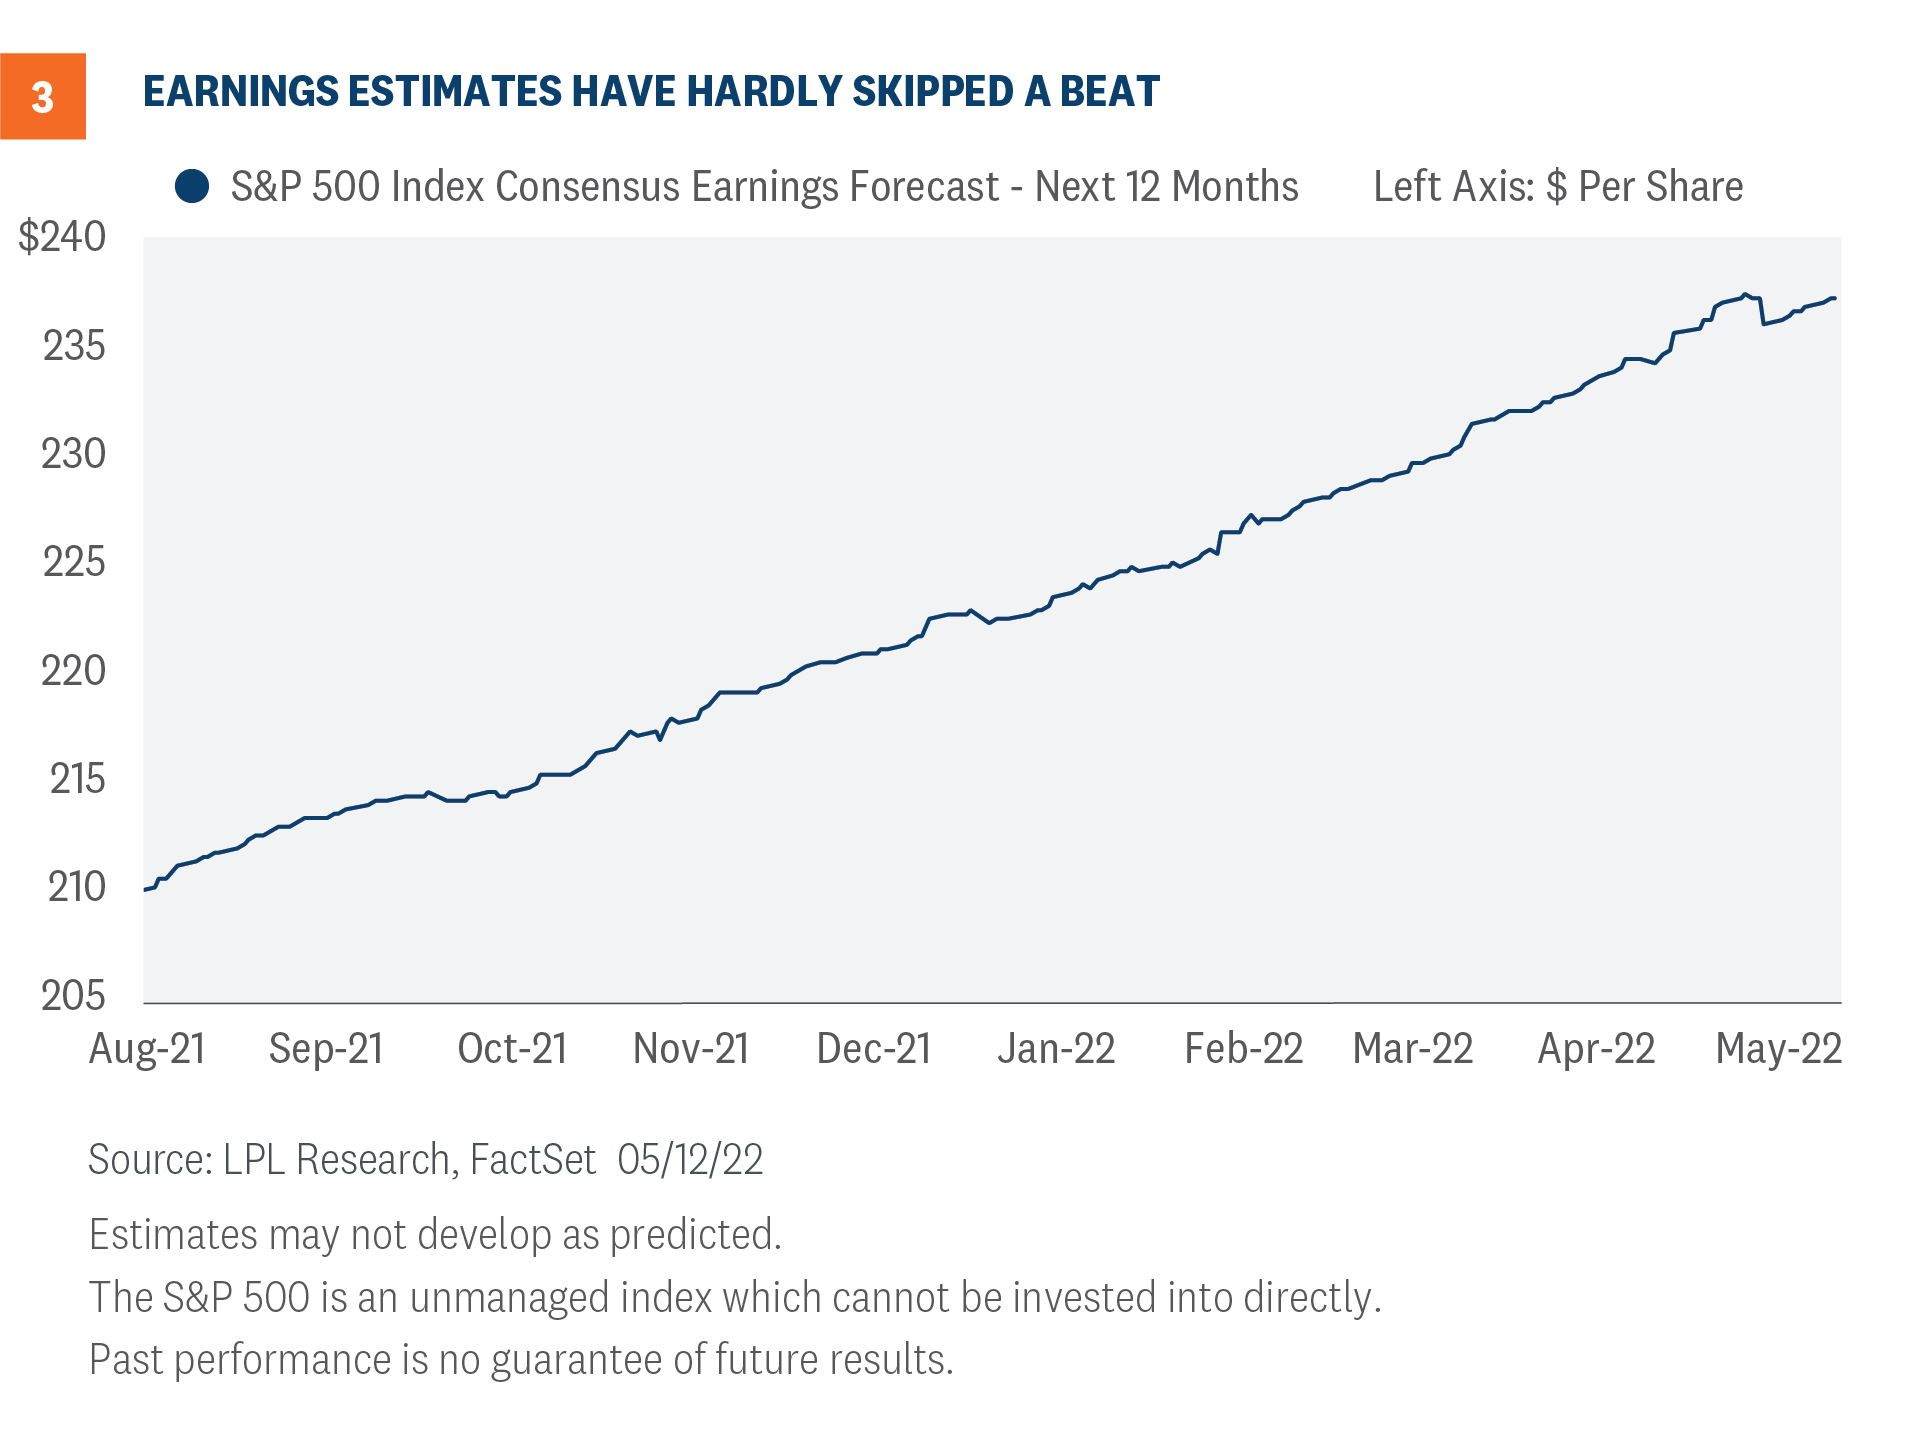
That led us to our conservative forecast for S&P 500 EPS in 2022 of $220, only 6% above the now-final EPS number for 2021. But instead of seeing estimates come down because of these cost pressures, they have continued to move higher. The consensus estimate for S&P 500 EPS in 2022 has increased 2.6% this year to $229.22 per share, which is remarkable considering how difficult the operating environment has become [Figure 3].
How have they done it? Primarily through pricing power that has boosted revenue. The consensus estimate for revenue this year has increased 4.2% year to date. It hasn’t been difficult to sell customers on the idea of paying higher prices in this environment when higher costs are affecting everyone. The good news is higher wages and pandemic savings have helped consumers afford those prices.
Companies have also managed higher costs efficiently, in many cases doing more with less. That narrative certainly fits the energy sector which is also enjoying a revenue windfall. Energy sector employment has fallen significantly over the past couple of years, according to Bureau of Labor Statistics data. National employment is still below pre-pandemic levels, yet trailing 12 month S&P 500 revenue is up 12%.
Bottom line, we recognize our $220 per share forecast for 2022 S&P 500 earnings is probably too low and that number probably comes in closer to $225, up 8% year over year.
Can Earnings Help This Market Turn Around?
Earnings will be part of the stock market rebound we expect over the rest of the year. We expect S&P 500 earnings to grow high single digits this year despite the aforementioned challenges. Those gains, coupled with much more reasonable valuations following the selloff, may help push stocks higher in the coming months.
However, inflation is the most important piece of the story. Until markets get confidence that inflation will move steadily lower over time and become comfortable with the role the Federal Reserve will play to get us there, P/E multiple expansion will be tough to come by and stocks may remain in correction territory. On the other side, keep in mind just two additional points on the P/E—from 16.5 to 18.5—would push the S&P 500 12% higher.
We continue to prefer a modest overweight allocation to equities and a slight underweight to fixed income relative to investors’ targets, as appropriate. Our year-end 2022 fair value target for the S&P 500 is 4,800–4,900, 19% above the May 13 closing price at the low end. We are actively considering adding to our equities allocation.
Click here to download a PDF of this report.
______________________________________________________________________________________________
IMPORTANT DISCLOSURES
This material is for general information only and is not intended to provide specific advice or recommendations for any individual. There is no assurance that the views or strategies discussed are suitable for all investors or will yield positive outcomes. Investing involves risks including possible loss of principal. Any economic forecasts set forth may not develop as predicted and are subject to change.
References to markets, asset classes, and sectors are generally regarding the corresponding market index. Indexes are unmanaged statistical composites and cannot be invested into directly. Index performance is not indicative of the performance of any investment and does not reflect fees, expenses, or sales charges. All performance referenced is historical and is no guarantee of future results.
Any company names noted herein are for educational purposes only and not an indication of trading intent or a solicitation of their products or services. LPL Financial doesn’t provide research on individual equities.
All information is believed to be from reliable sources; however, LPL Financial makes no representation as to its completeness or accuracy.
The Standard & Poor’s 500 Index (S&P500) is a capitalization-weighted index of 500 stocks designed to measure performance of the broad domestic economy through changes in the aggregate market value of 500 stocks representing all major industries.
The Consumer Price Index (CPI) is a measure of the average change over time in the prices paid by urban consumers for a market basket of consumer goods and services.
The PE ratio (price-to-earnings ratio) is a measure of the price paid for a share relative to the annual net income or profit earned by the firm per share. It is a financial ratio used for valuation: a higher PE ratio means that investors are paying more for each unit of net income, so the stock is more expensive compared to one with lower PE ratio.
Earnings per share (EPS) is the portion of a company’s profit allocated to each outstanding share of common stock. EPS serves as an indicator of a company’s profitability. Earnings per share is generally considered to be the single most important variable in determining a share’s price. It is also a major component used to calculate the price-to-earnings valuation ratio.
All index data from FactSet.
This research material has been prepared by LPL Financial LLC.
Securities and advisory services offered through LPL Financial (LPL), a registered investment advisor and broker-dealer (member FINRA/SIPC). Insurance products are offered through LPL or its licensed affiliates. To the extent you are receiving investment advice from a separately registered independent investment advisor that is not an LPL affiliate, please note LPL makes no representation with respect to such entity.
| Not Insured by FDIC/NCUA or Any Other Government Agency | Not Bank/Credit Union Guaranteed | Not Bank/Credit Union Deposits or Obligations | May Lose Value |
RES-1157400-0522 | For Public Use | Tracking # 1-05281392 (Exp. 5/23)