It’s been a very tough start to the year with both stocks and bonds down sharply. Adding to the “wall of worry” for investors are the highest levels of U.S. inflation in decades, an aggressive Federal Reserve (Fed), Chinese lockdowns, and continuing war in Europe. So perhaps it is no surprise that investor sentiment polls are showing signs of extreme pessimism. Extremes in sentiment tend to be contrarian indicators for the stock market over the short-to-medium-term, but have we really seen extreme pessimism yet? Below we look at some of the latest investor sentiment data and share our thoughts about the disparity between what investors are saying and what they are actually doing.
What Investors are Saying: Extreme Pessimism
When investors are asked their opinions about the outlook for the stock market, recent responses have been very bearish. The sentiment data derived from these surveys and polls has in some instances reached multi-decade levels of pessimism (which as a contrarian signal would be positive for markets):
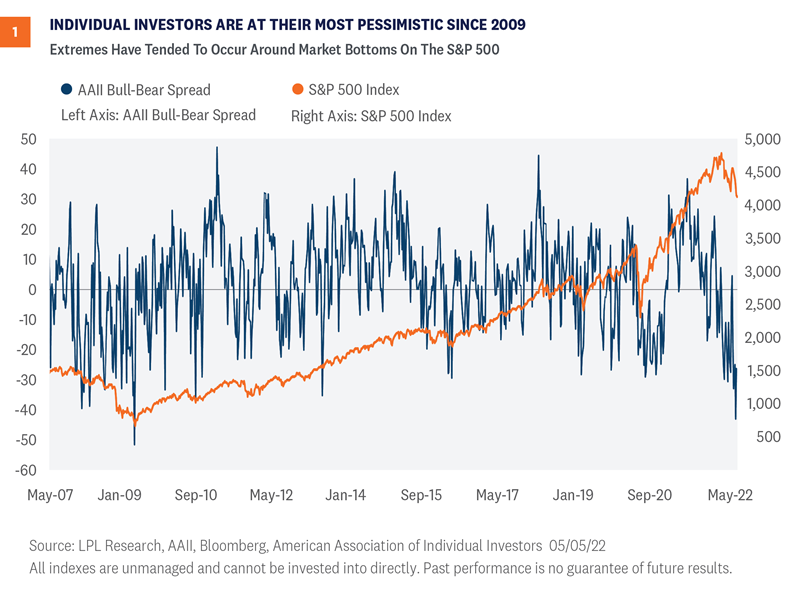
1) AAII Investor Sentiment Survey. The individual investors surveyed weekly by the American Association of Individual Investors (AAII) have displayed extreme levels of pessimism in recent weeks. The readings in April included the lowest number of bullish investors in almost 30 years (15.8% on April 14) and the highest number of bearish investors since 2009 (59.4% on April 28). As shown in Figure 1, the spread between the number of investors who are bullish and those who are bearish has recently reached extreme levels not seen since 2009.
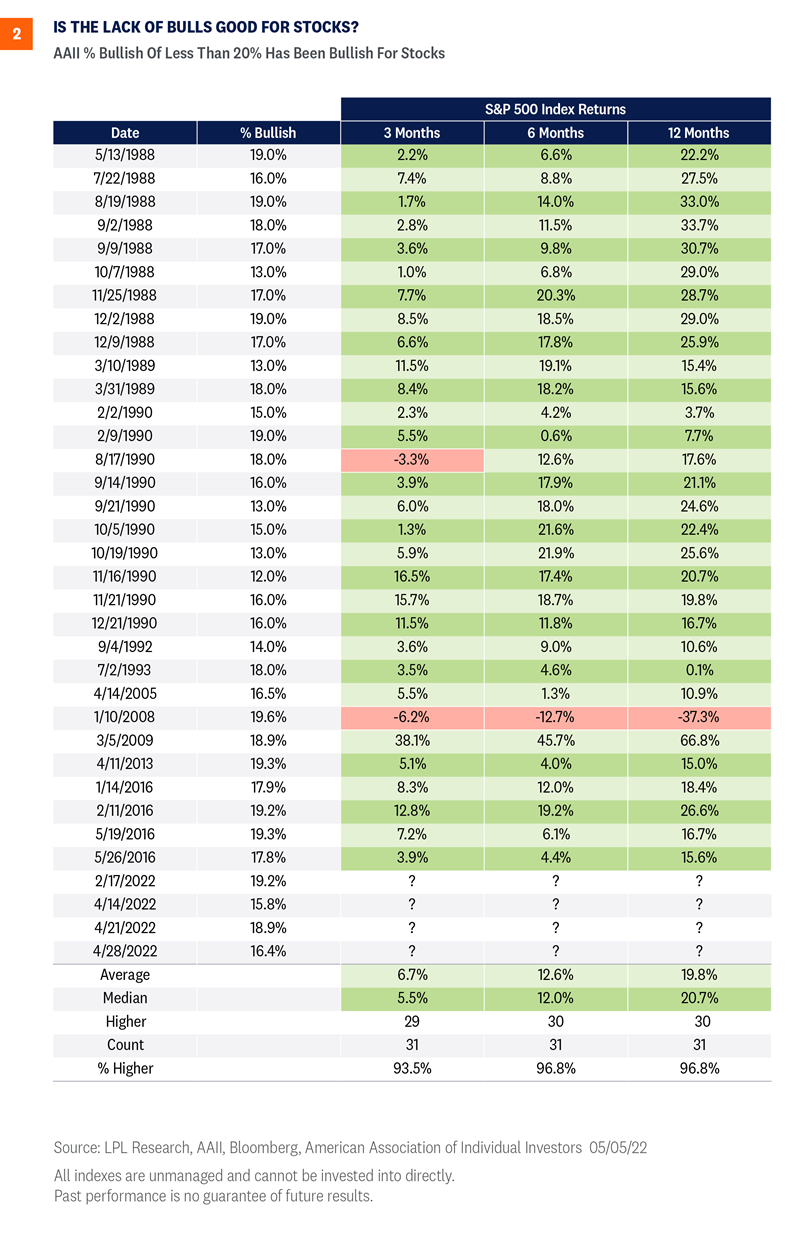
In April the number of investors who said they were bullish was under 20% for three weeks in a row, which is only the second time this has occurred (the first was in 1988). When bulls have dropped below 20%, it’s tended to be a strong contrarian indicator of above average short-term returns ahead. As shown in Figure 2, when the number of bullish investors has fallen below 20% the forward three-month returns have been negative only twice and the forward six and 12-month returns negative only once (during the Great Financial Crisis of 2008-09).
2) Investors Intelligence Advisors Sentiment Report. This sentiment report surveys over 100 independent investment newsletters and reports the percentage of advisors that are bullish, bearish, and those that expect a correction. The ratio of bulls to bears dropped to 0.79 on May 3. Levels under 1 have typically been seen only toward the end of bear markets or corrections.
3) Barron’s Big Money Poll. This poll is taken twice a year, with the most recent poll closing in April and drawing 112 responses from professional money managers. When asked about their clients’ outlook for stocks, 24% said they were bearish, which was twice as many as the 12% who said their clients were bullish. Interestingly, when those same money managers were asked if they had been net buyers, net sellers, or had made no change to their U.S. equity allocation this year, only 21% were net sellers, which leads us to our next point.
What Investors are Doing: Selling but Not Panic Selling
The other type of sentiment data we look at is derived from actual market data to reveal what investors are actually doing. This data is showing some fear, but overall it is more subdued and has not yet hit levels consistent with the capitulation and indiscriminate selling that we normally see at market bottoms:
1) Chicago Board Options Exchange (CBOE) Put-Call Ratio. This measures the ratio of put options purchased by bearish market participants (those hedging against losses) to the number of call options purchased by bullish traders. Used as a contrarian indicator, a high ratio indicates the mood of the market may be overly bearish and stocks may rebound following indiscriminate selling. The five-day average of the total put-call ratio has been on the rise recently, but has still yet to reach the 1.2 level that we typically consider a signal, and is well short of the greater than 1.3 readings seen at the March 2020 and December 2018 market bottoms.
2) CBOE Volatility Index (VIX). The VIX is calculated by aggregating the weighted prices of put and call options placed on the S&P 500 Index and can be considered a measure of expected 30-day volatility of the U.S stock market. The VIX is often referred to as the “fear gauge” because it spikes in times of market worries and when stocks go down. At the start of May, the VIX reached around 36 intraday and closed at a similar level in early March but we would need to see the VIX hit at least 40 to signal that extreme fear was present among market participants.
Conclusion
Investor pessimism tends to be a contrarian signal for above-average expected stock market returns and can indicate that many sellers have already exited the market (likewise, extreme optimism can indicate there are not many remaining potential buyers). The more extreme the pessimism, the higher the expected returns, on average, as these extremes in pessimism often occur at market bottoms.
The sentiment indicators, which ask investors for their opinions, are signaling extreme levels of pessimism, but indicators based on actual market data have not reached levels that are normally associated with stock market bottoms. Overall, our assessment is that negative sentiment is a positive signal for equities, but not yet at such extreme levels that we believe it sufficient to add risk.
We continue to monitor sentiment data closely to see if investors are actually as pessimistic as they say they are. Further signs of extreme fear and panic selling in the market data may present a tactical opportunity to add to risk assets.
We continue to prefer a modest overweight allocation to equities (tilting towards defensive sectors) and a slight underweight to fixed income relative to investors’ targets, as appropriate. Our year-end 2022 fair value target for the S&P 500 is 4,800–4,900 based on a price to earnings ratio of 20.5 and our 2023 S&P 500 earnings per share forecast of $235.
Click here to download a PDF of this report.
______________________________________________________________________________________________
IMPORTANT DISCLOSURES
This material is for general information only and is not intended to provide specific advice or recommendations for any individual. There is no assurance that the views or strategies discussed are suitable for all investors or will yield positive outcomes. Investing involves risks including possible loss of principal. Any economic forecasts set forth may not develop as predicted and are subject to change.
References to markets, asset classes, and sectors are generally regarding the corresponding market index. Indexes are unmanaged statistical composites and cannot be invested into directly. Index performance is not indicative of the performance of any investment and does not reflect fees, expenses, or sales charges. All performance referenced is historical and is no guarantee of future results.
Any company names noted herein are for educational purposes only and not an indication of trading intent or a solicitation of their products or services. LPL Financial doesn’t provide research on individual equities.
All information is believed to be from reliable sources; however, LPL Financial makes no representation as to its completeness or accuracy.
The Standard & Poor’s 500 Index (S&P500) is a capitalization-weighted index of 500 stocks designed to measure performance of the broad domestic economy through changes in the aggregate market value of 500 stocks representing all major industries.
All index data from FactSet.
This research material has been prepared by LPL Financial LLC.
Securities and advisory services offered through LPL Financial (LPL), a registered investment advisor and broker-dealer (member FINRA/SIPC). Insurance products are offered through LPL or its licensed affiliates. To the extent you are receiving investment advice from a separately registered independent investment advisor that is not an LPL affiliate, please note LPL makes no representation with respect to such entity.
| Not Insured by FDIC/NCUA or Any Other Government Agency | Not Bank/Credit Union Guaranteed | Not Bank/Credit Union Deposits or Obligations | May Lose Value |
RES-1149552-0522 | For Public Use | Tracking # 1-05278262 (Exp. 5/23)