“Sell in May and go away” is probably the most widely cited stock market cliché in history. Every year a barrage of Wall Street commentaries, media stories, and investor questions flood in about the popular stock market adage. In this week’s Weekly Market Commentary, we tackle this commonly cited seasonal pattern and why it might not play out this year, similar to recent years.
The Worst Six Months of the Year
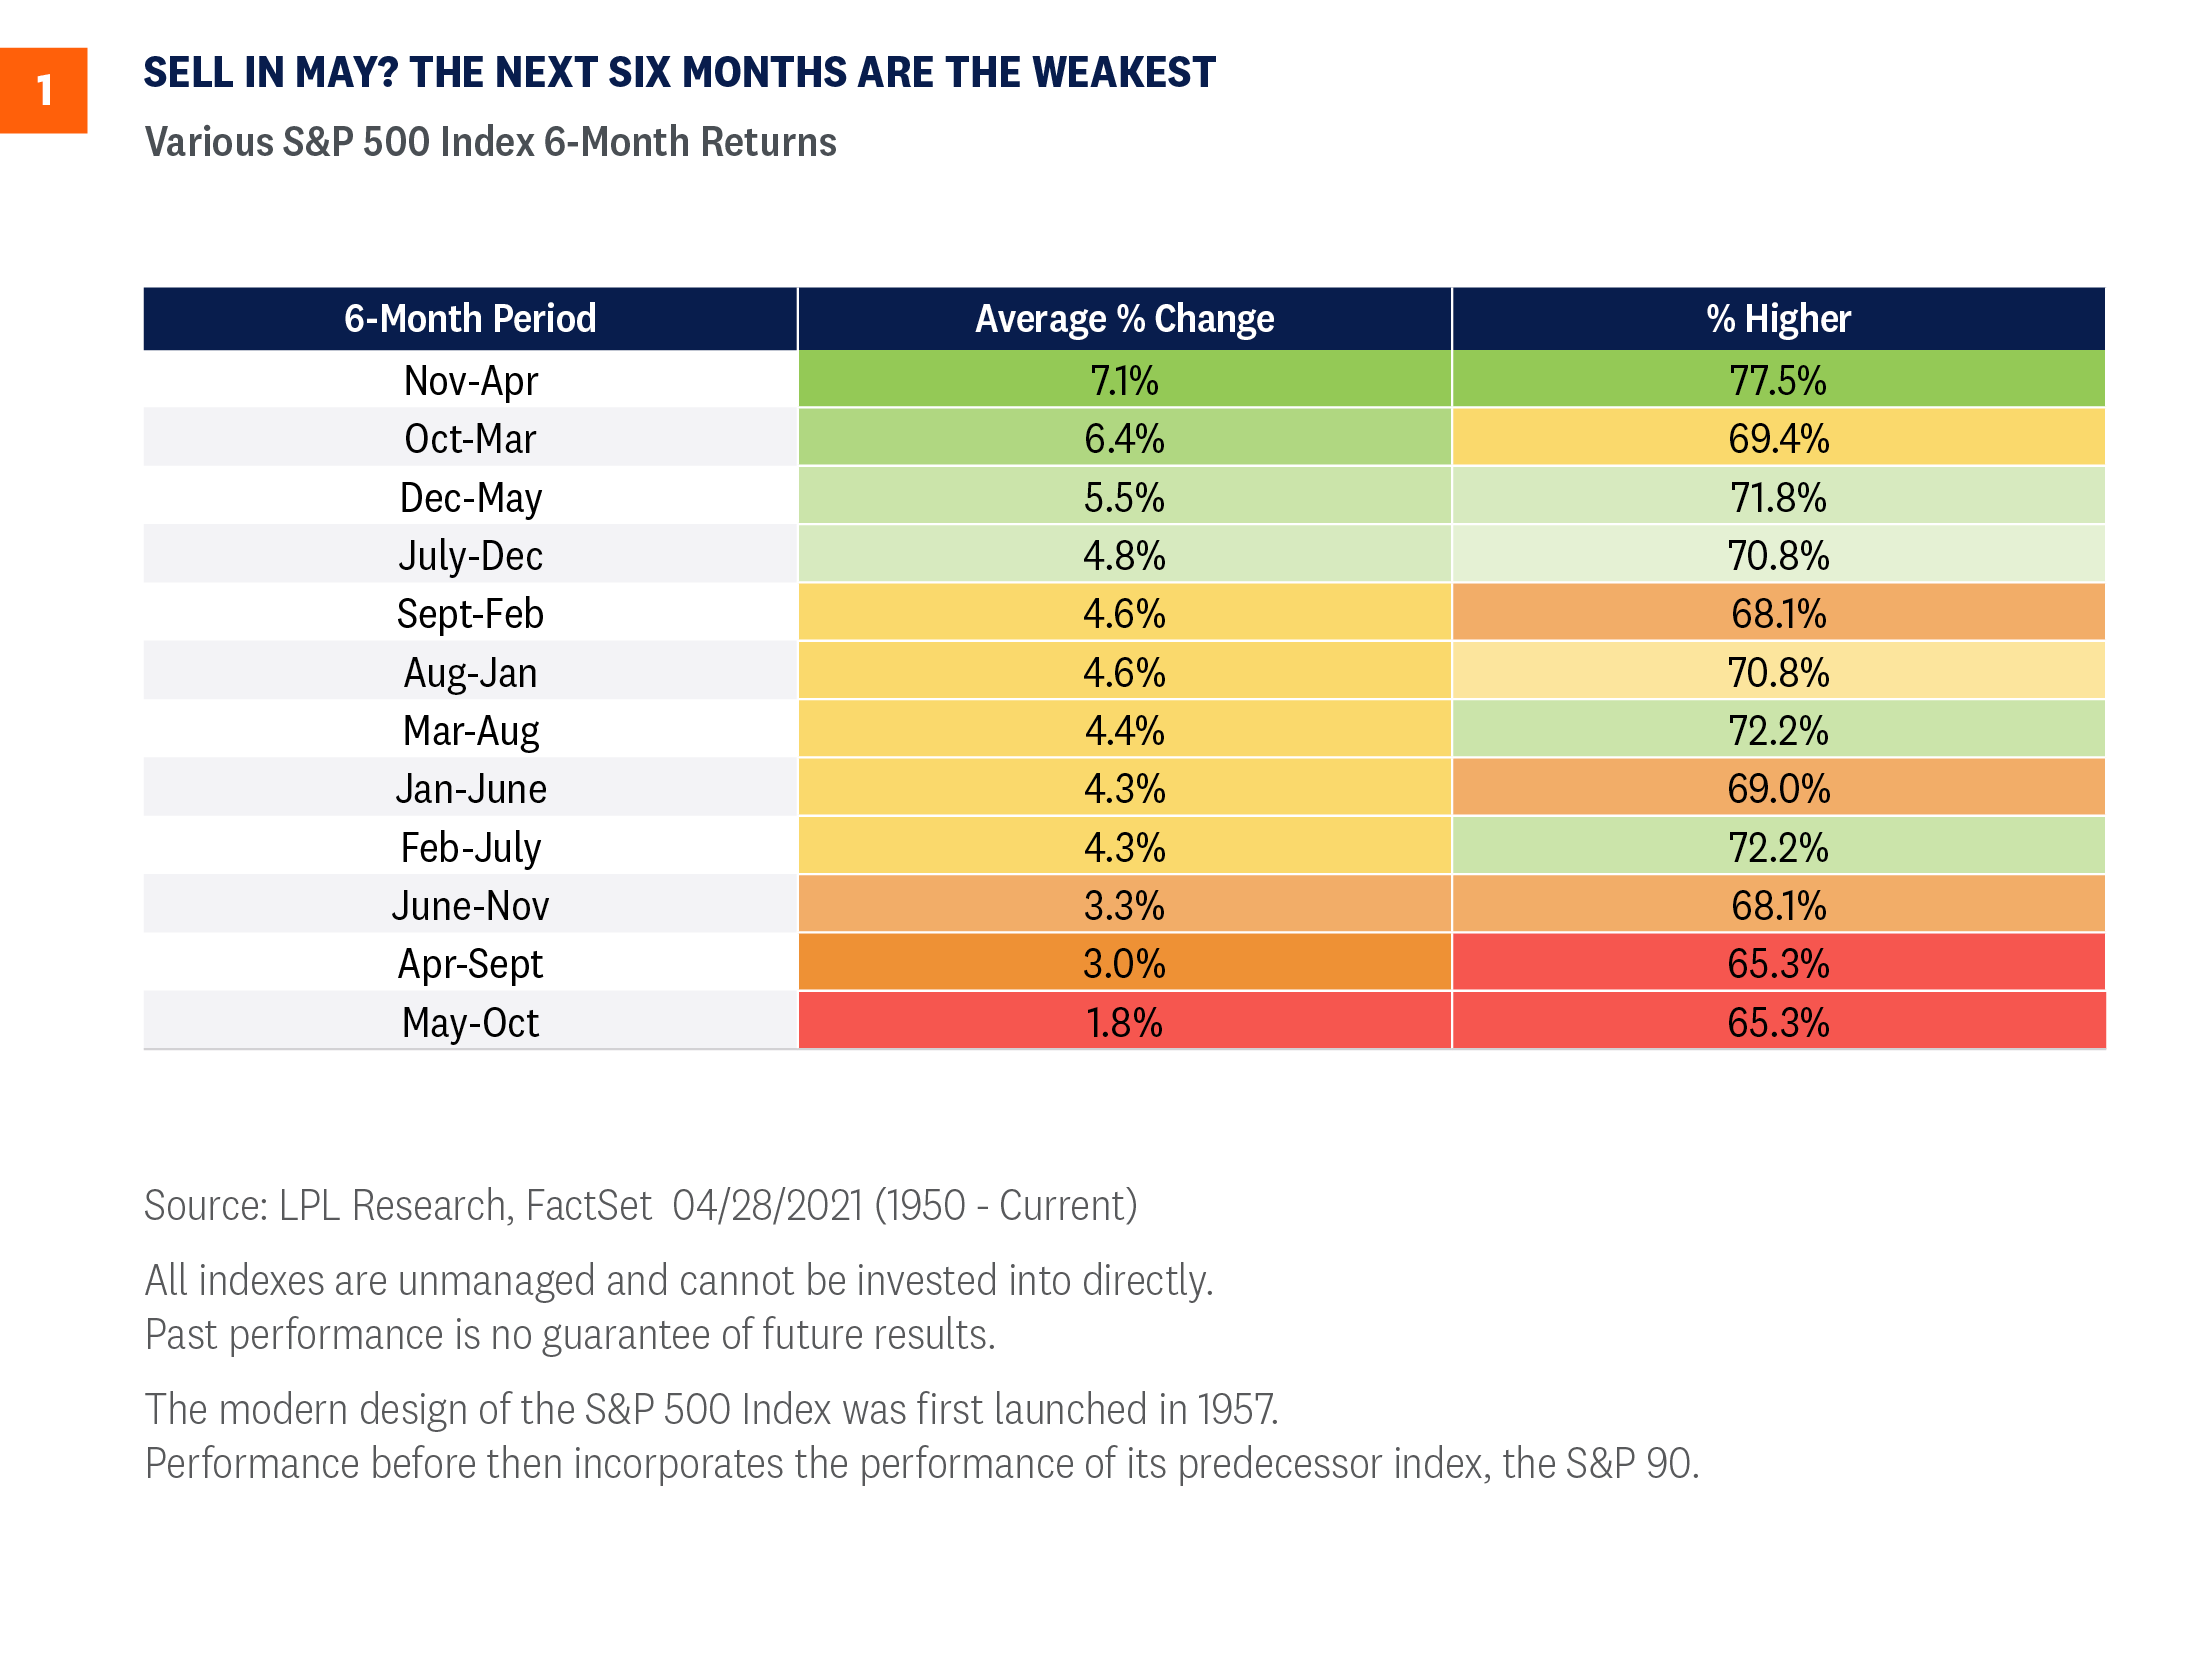
“Sell in May and go away” is the seasonal stock market pattern in which the six months from May through October are historically weak for stocks, with many investors believing that it’s better to avoid the market altogether by selling in May and moving to cash during the summer months.
“Sell in May and go away” began in England originally as “sell in May and go away until St. Leger’s Day.” The saying was based around the St. Leger Stakes, a popular horse race in September that marked the end of summer and a return of the big traders and market volume.
As [Figure 1] shows, since 1950 the S&P 500 Index has gained 1.8% on average during these six months, compared with 7.1% during the November to April period. In fact, out of all six-month combinations, the May through October period has produced the weakest—and least positive—average return.
But as with many things in life, it is never that simple.
What have you done for me lately?
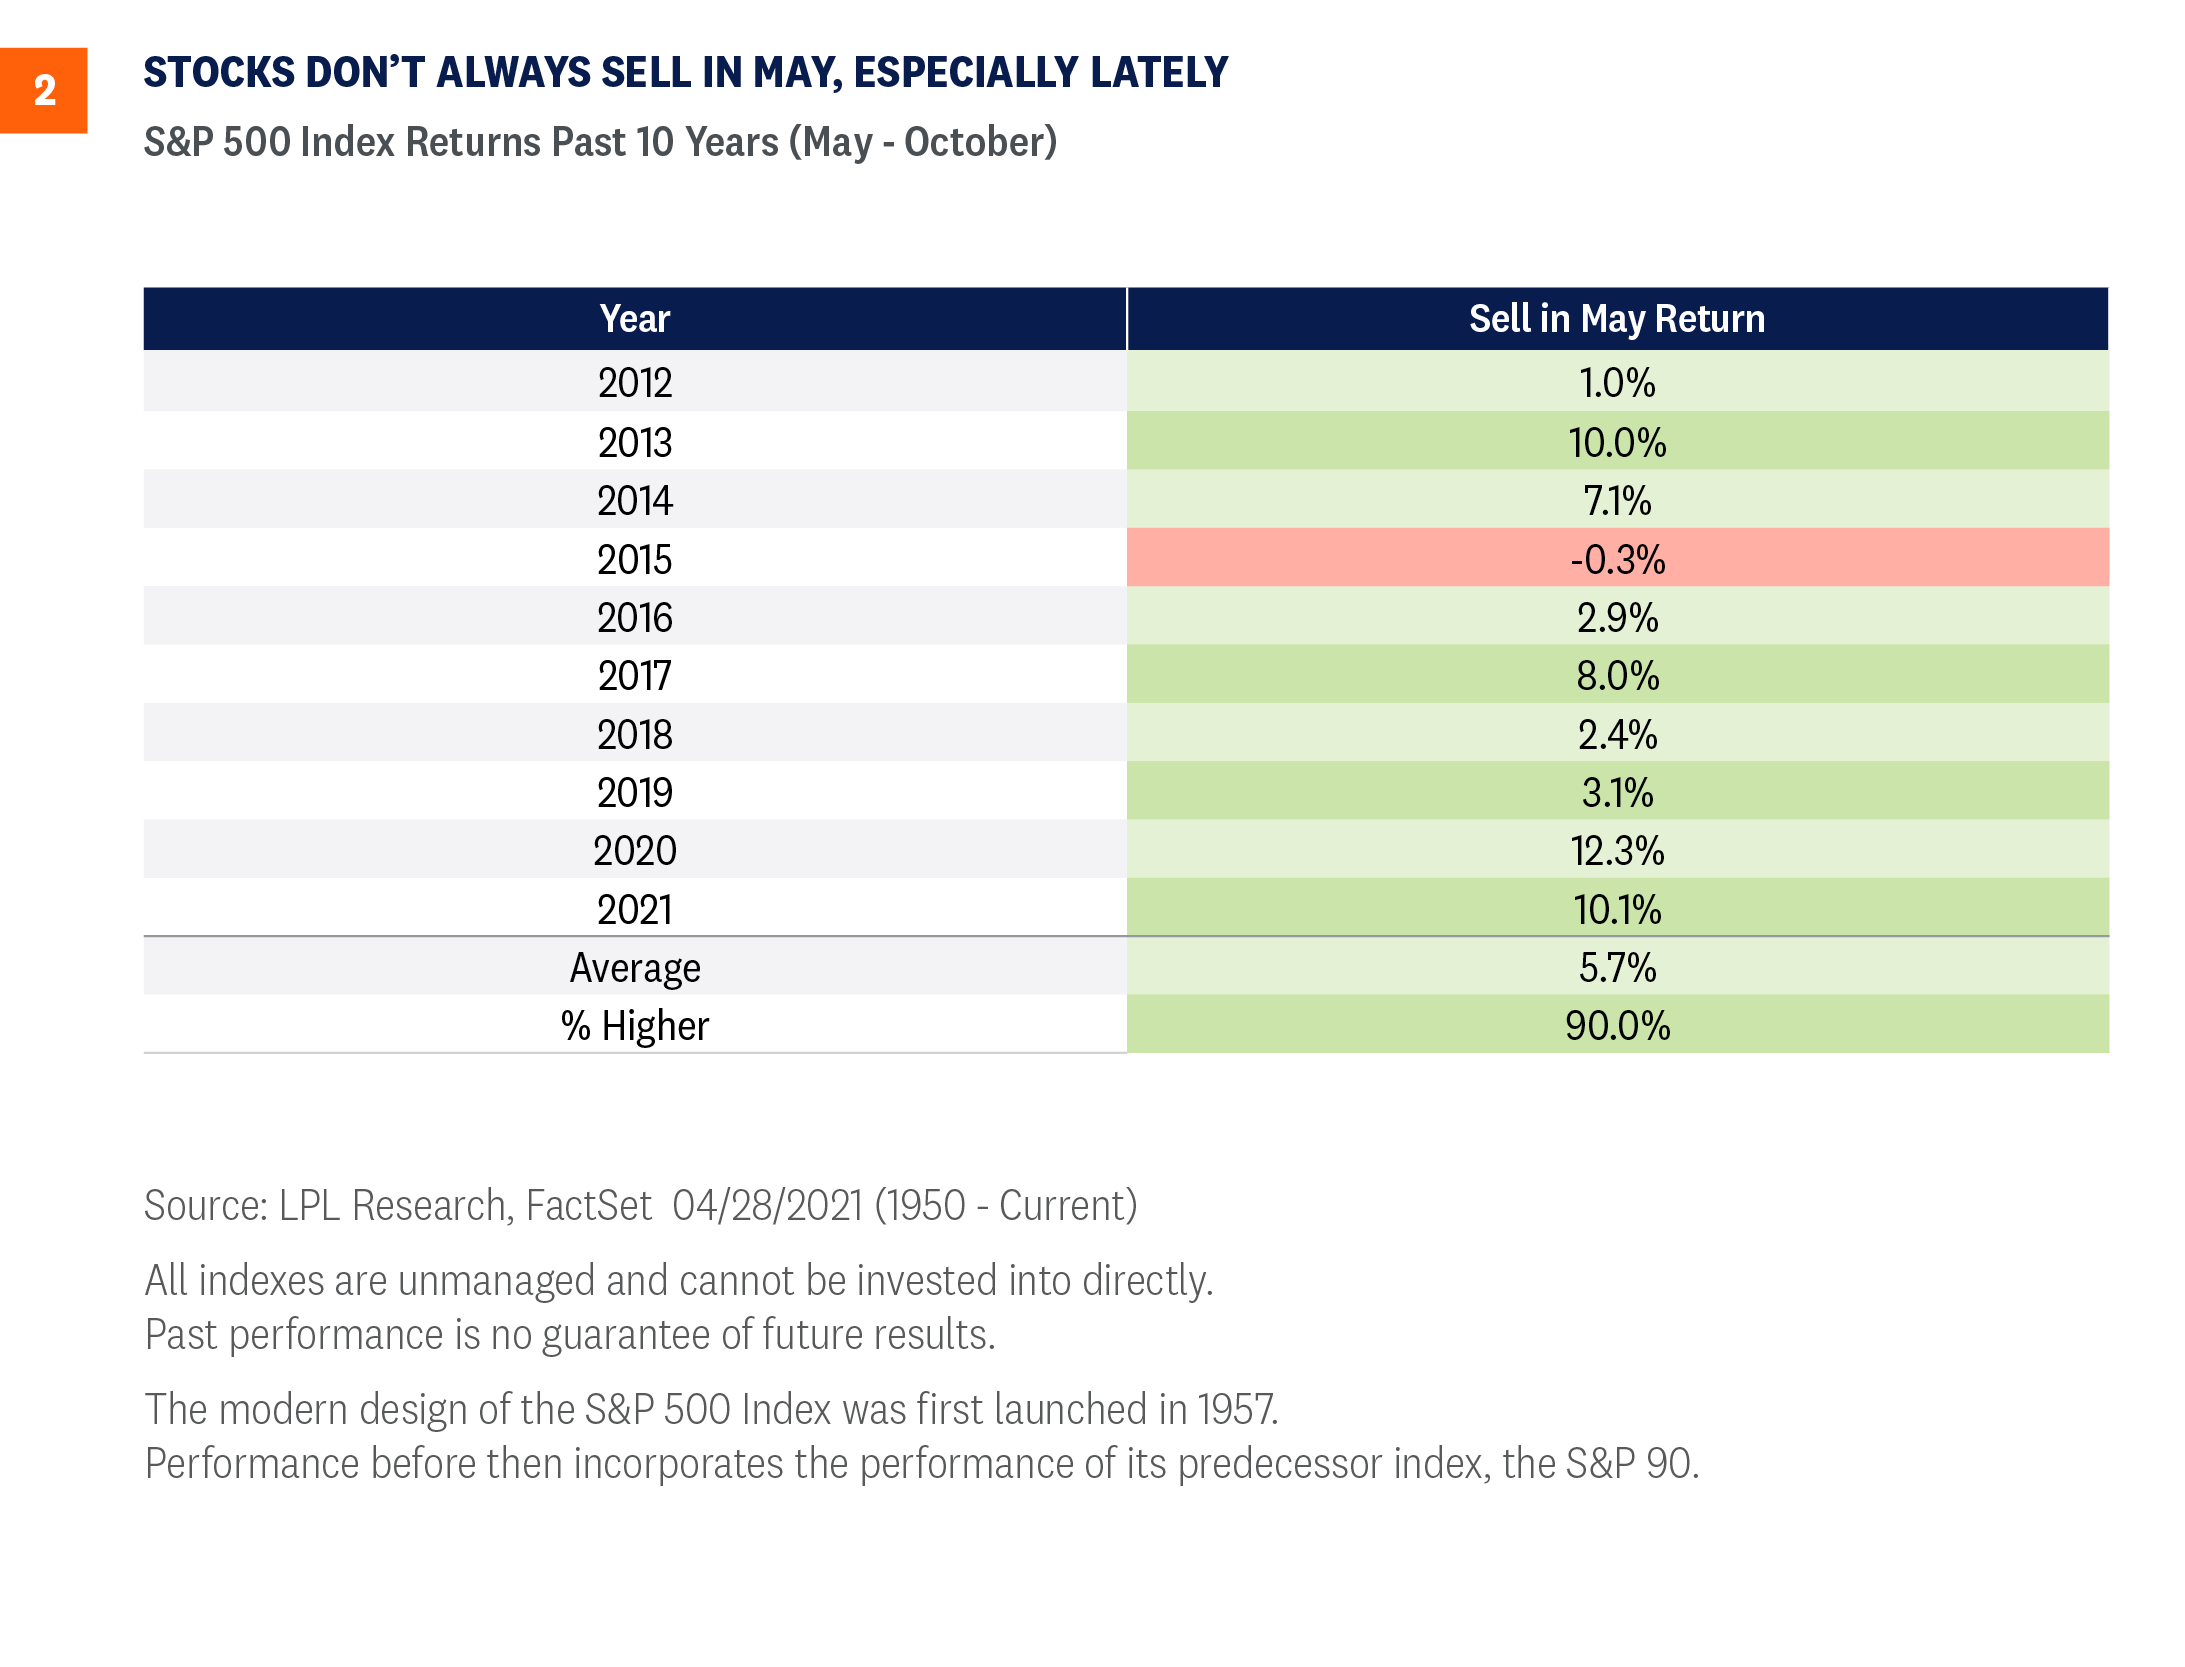
As we head into this seasonally weak period, keep a few things in mind. First, the S&P 500 Index has closed higher during the month of May in eight of the past nine years—so “Sell in June” might be more appropriate. In addition, various sentiment signals we follow are showing extreme caution and fear, potentially bullish from a contrarian point of view. The CBOE VIX Index (VIX) recently spiked above 30, consistent with stock market lows. Various sentiment polls are flashing extreme fear, while money managers are sitting on a good deal of cash as well. Lastly, we don’t see a recession in 2022, and despite lackluster Q1 gross domestic product (GDP) reported on April 28, we continue to expect economic growth of 3% this year, led by strong corporate earnings, accelerating business investment, and a healthy consumer.
Here’s the catch—and there’s always a catch: These ‘worst six months of the year’ have been quite strong lately. In fact, stocks gained nine of the past 10 years during these six months, as you can see in [Figure 2]. So, although our guard is up for some potential seasonal weakness and choppy action, be aware it could be short-lived and consider using it as a buying opportunity.
Is this actually normal?
Clearly 2022 has been one of the worst starts to a year ever for stocks, but how rare is it? Here are some statistics to potentially help calm some nerves.
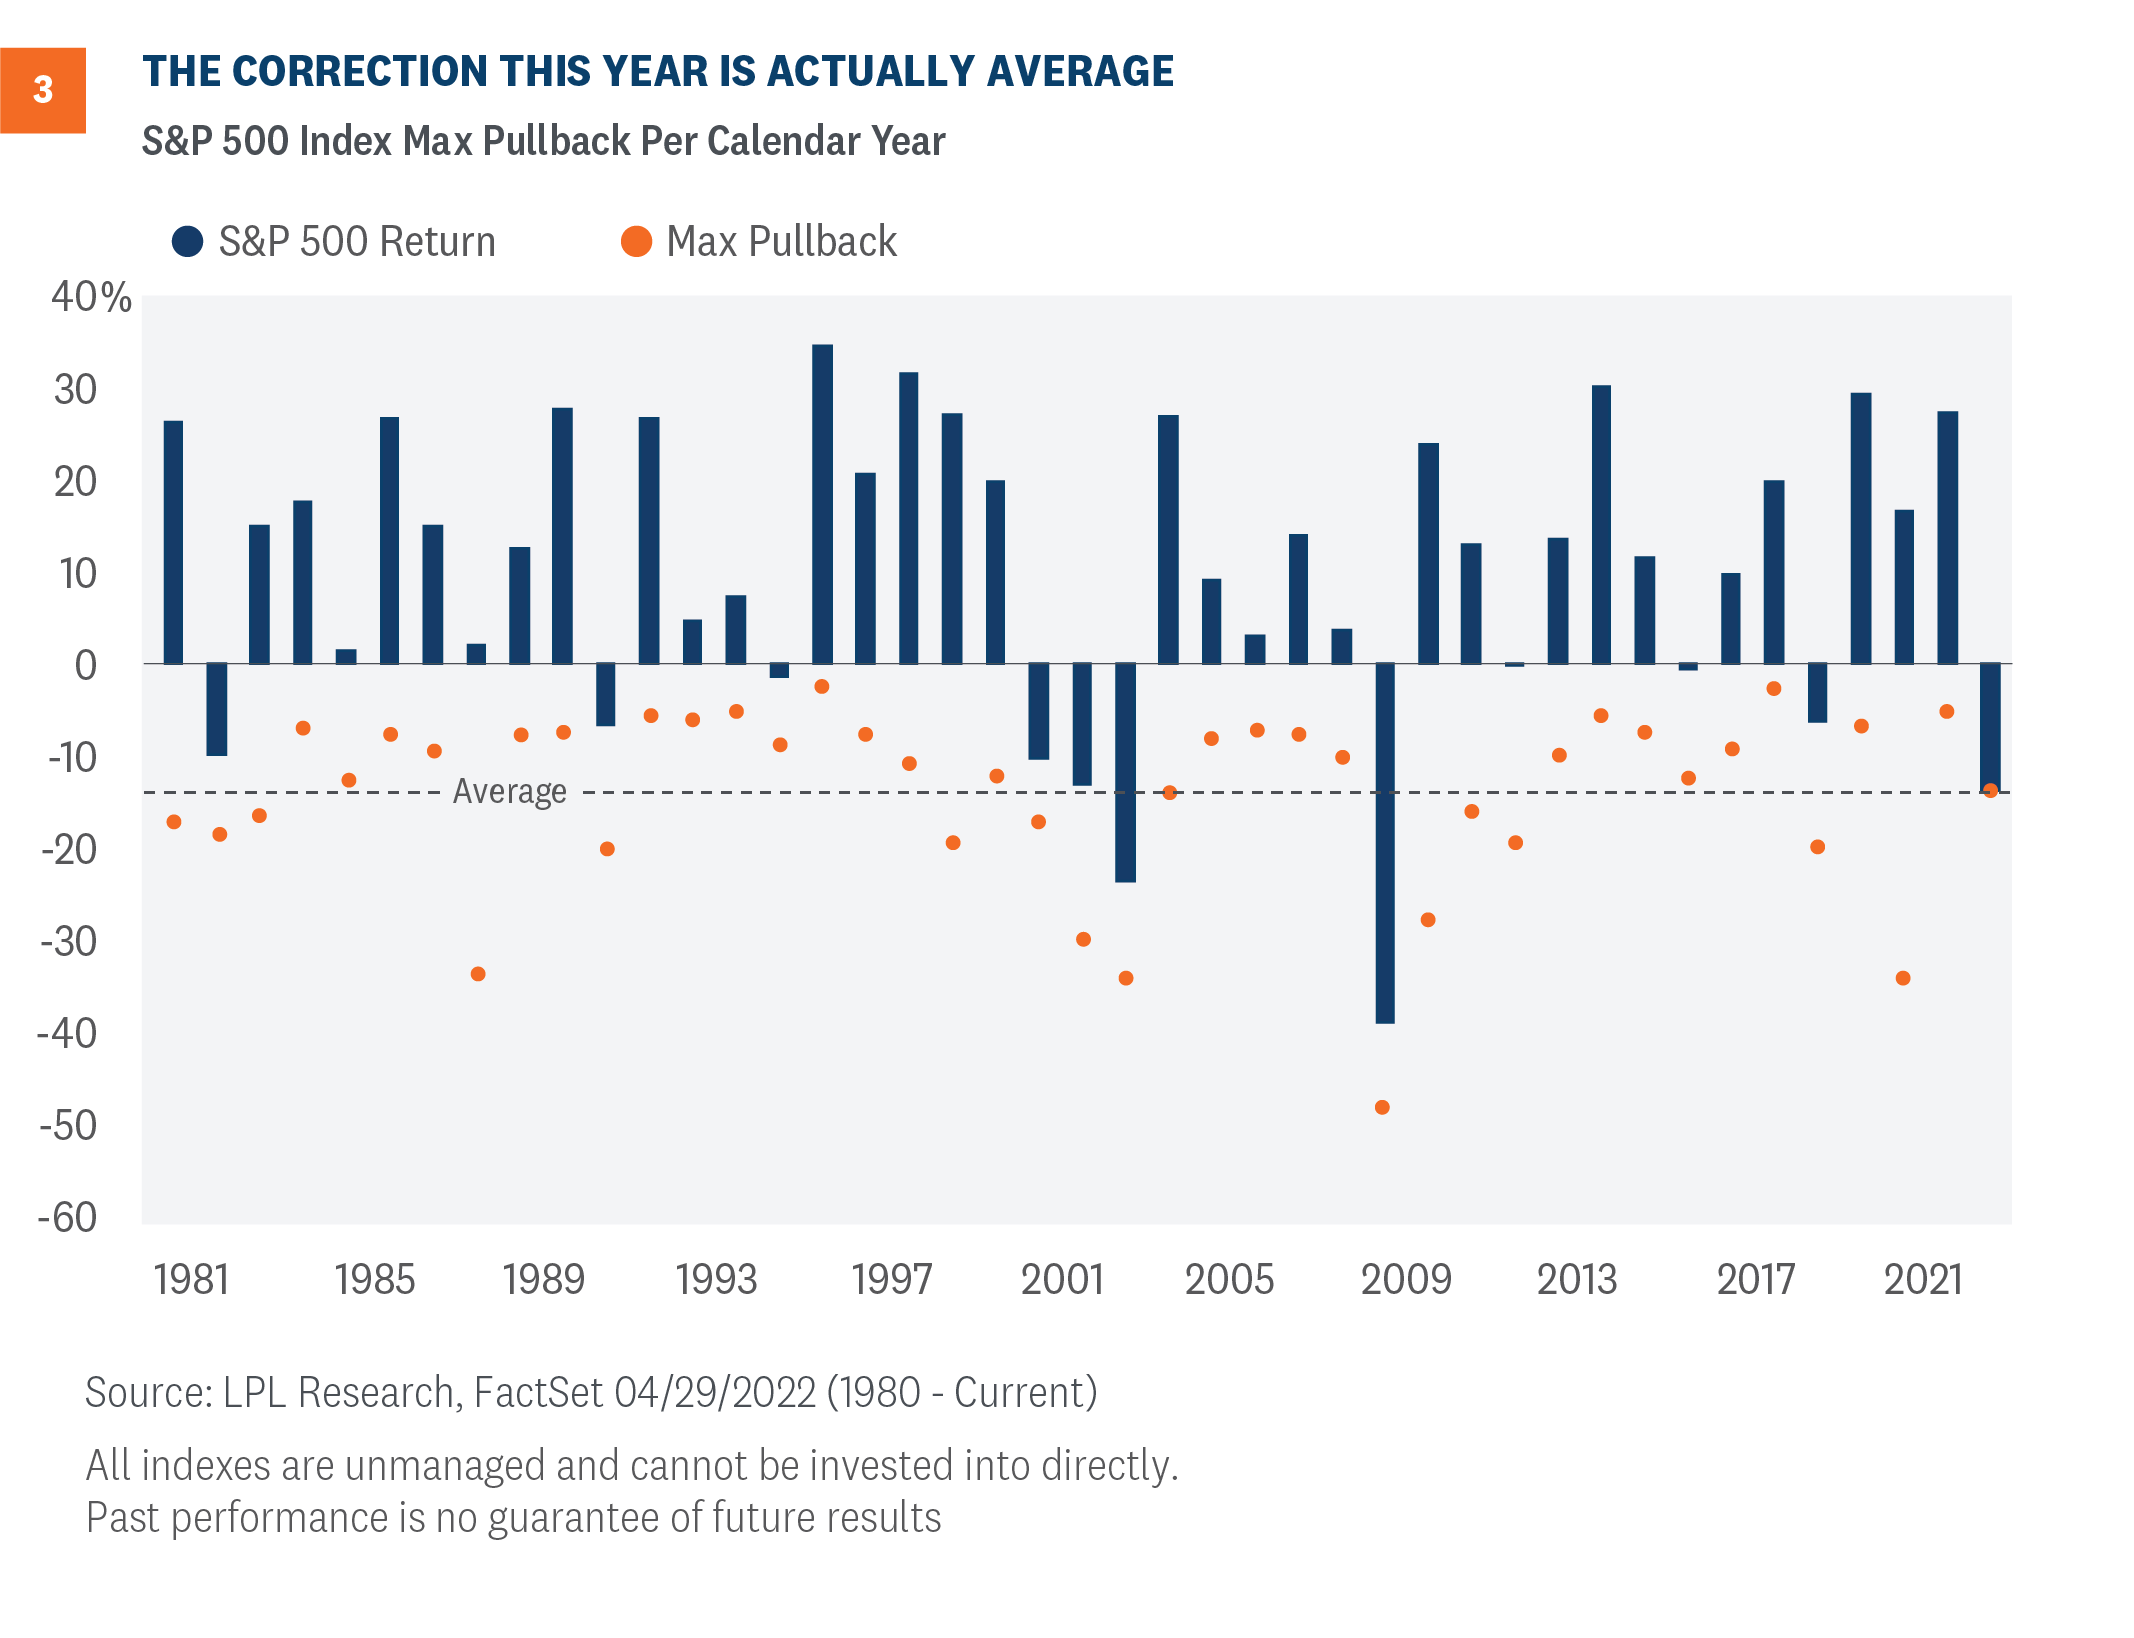
- The S&P 500 Index has fallen 13.9% peak to trough this year, near the 14% average of all years since 1980. In other words, this year is fairly average so far.
- During midterm election years, the average stock market correction is 17%, but stocks rebounded 32% on average in the 12 months following those midterm year lows.
- Of the last 21 times the S&P 500 has corrected double-digits in a given year since 1980, stocks rallied back to end the year positive 12 times.
- During those 12 positive years, the average gain at the end of the year has been a stellar 17%.
As [Figure 3] shows, the correction so far in 2022 is line with an average correction.
Conclusion
The media will have fun with the “Sell in May” warning to drive up clicks and views. Although you can’t argue that these months historically have been weak, they still sport a positive return, so totally going away may not be wise. With sentiment flashing extreme caution, a healthy consumer, and strong corporate earnings, going away this May is something we would not subscribe to.
We continue to prefer a modest overweight allocation to equities and a slight underweight to fixed income relative to investors’ targets, as appropriate. Our year-end 2022 fair value target for the S&P 500 is 4,800–4,900, based on a price-to-earnings ratio of 20.5, and our 2023 S&P 500 earnings forecast of $235 per share.
Click here to download a PDF of this report.
______________________________________________________________________________________________
IMPORTANT DISCLOSURES
This material is for general information only and is not intended to provide specific advice or recommendations for any individual. There is no assurance that the views or strategies discussed are suitable for all investors or will yield positive outcomes. Investing involves risks including possible loss of principal. Any economic forecasts set forth may not develop as predicted and are subject to change.
References to markets, asset classes, and sectors are generally regarding the corresponding market index. Indexes are unmanaged statistical composites and cannot be invested into directly. Index performance is not indicative of the performance of any investment and does not reflect fees, expenses, or sales charges. All performance referenced is historical and is no guarantee of future results.
Any company names noted herein are for educational purposes only and not an indication of trading intent or a solicitation of their products or services. LPL Financial doesn’t provide research on individual equities.
All information is believed to be from reliable sources; however, LPL Financial makes no representation as to its completeness or accuracy.
The CBOE VIX is a measure of the volatility implied in the prices of options contracts for the S&P 500. It is a market-based estimate of future volatility. When sentiment reaches one extreme or the other, the market typically reverses course. While this is not necessarily predictive it does measure the current degree of fear present in the stock market.
The Standard & Poor’s 500 Index (S&P500) is a capitalization-weighted index of 500 stocks designed to measure performance of the broad domestic economy through changes in the aggregate market value of 500 stocks representing all major industries.
The PE ratio (price-to-earnings ratio) is a measure of the price paid for a share relative to the annual net income or profit earned by the firm per share. It is a financial ratio used for valuation: a higher PE ratio means that investors are paying more for each unit of net income, so the stock is more expensive compared to one with lower PE ratio.
Earnings per share (EPS) is the portion of a company’s profit allocated to each outstanding share of common stock. EPS serves as an indicator of a company’s profitability. Earnings per share is generally considered to be the single most important variable in determining a share’s price. It is also a major component used to calculate the price-to-earnings valuation ratio.
All index data from FactSet.
This research material has been prepared by LPL Financial LLC.
Securities and advisory services offered through LPL Financial (LPL), a registered investment advisor and broker-dealer (member FINRA/SIPC). Insurance products are offered through LPL or its licensed affiliates. To the extent you are receiving investment advice from a separately registered independent investment advisor that is not an LPL affiliate, please note LPL makes no representation with respect to such entity.
| Not Insured by FDIC/NCUA or Any Other Government Agency | Not Bank/Credit Union Guaranteed | Not Bank/Credit Union Deposits or Obligations | May Lose Value |
RES-1141600-0422 | For Public Use | Tracking # 1-05274661 (Exp. 4/23)